Arta_Tic
3D acoustic measurements using Arta_Tic and your own measurement platform.
# About Arta_Tic
Arta_Tic is a simple Windows program I have written that allows DIYers to build am inexpensive automated platform for conducting 3D acoustic measurements using ARTA. Arta_Tic acts as an interface between ARTA and a stepper motor controller called a Tic.
Arta_Tic takes commands from ARTA (move to n degrees, go home), computes the proper number of steps according to your set-up, and then outputs the proper commands to your Tic.
Arta_Tic was written in Python.
# Why 3D Measurements?
In the past, figuring out what made a speaker sound good was difficult. Many manufacturers only measured their speakers from in front of the speaker, but found that two speakers that measured similarly sounded very different.
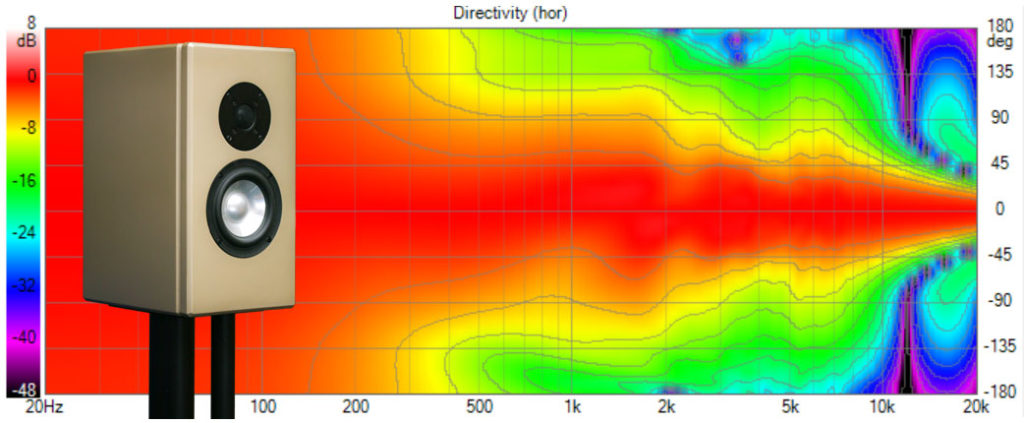
What was gradually discovered was that the total radiation of a loudspeaker (not just the radiation immediately in front) impacted sound quality. Peer reviewed research has determined the radiation pattern required for the best sound.
Capturing this radiation requires a series of measurements taken all the way around the speaker. This is extremely time consuming to do manually. Arta_Tic helps automate the process of making dozens or hundreds of measurements. Before, to measure a symmetrical speaker with 2 drivers at 15° resolution, with one measurement every 2 minutes, you would spend around 2.5 hours. By automating this process, you can do the same work in around half an hour, and make fewer mistakes.
# Configuration
Configuration is simple enough. First, install the Tic Software. This will install two programs: ticcmd, the command line interface for controlling the Tic, and Tic Control Center, which is a handy GUI for testing the functionality of your Tic.
Second, in the Arta_Tic folder, open ‘motor.config’ in a text editor. You should see something like this:
gear_ratio = 9
motor_degrees = 1.8
microstep = 1
These constants will be particular to your setup and will be used to calculate the number of motor steps for each degree of rotation called for by ARTA.
gear_ratio is the mechanical advantage between the motor gear and the drive gear you’re using. If you have a pulley gear of 20T and a drive gear of 180t, this value will be 9.
motor_degrees is the number of degrees that your rotates per step. The vast majority of stepper motors have 360°/200 steps = 1.8 degrees.
microstep corresponds to the microstep setting you are using. Enter .25 for quarter steps, .5 for half steps, and so on. If you are not using microstepping (which I recommend), enter 1.
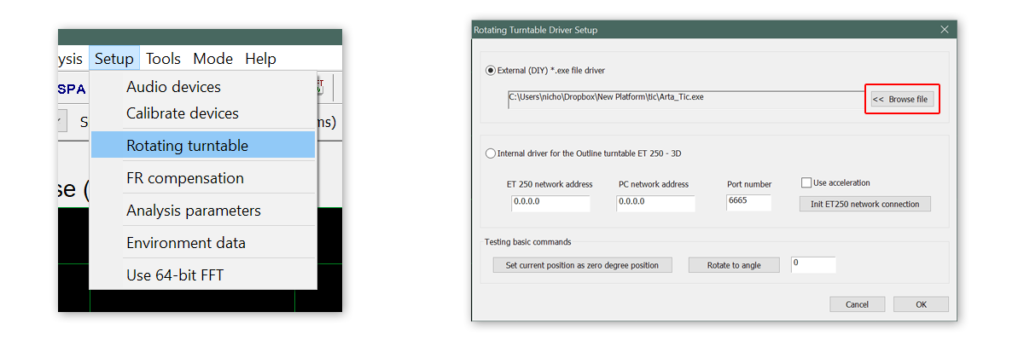
Finally, open ARTA and go to the Setup → Rotating Turntable menu. From there, enter the path for Arta_Tic.exe in the space indicated. Use the test buttons at the bottom of this window to test the functionality of your platform.
If everything works, you should be ready to make some measurements! Arta_Tic was designed with the acoustic simulation software VituixCAD in mind. VituixCAD can help you design speakers with great accuracy, so long the measurements you take are accurate. See this paper from the VituixCAD documentation to learn how to process the ARTA impulse responses properly for simulation.
# Building an Acoustic Measurement Platform
In order to use Arta_Tic, you’ll need a measurement platform. I will show you how I built mine.
My platform consists of a few simple wooden pieces attached to a few 3d printed parts. The most important 3D printed part is the main 324T gear, which has teeth that mesh with a standard GT2 belt.
In order to protect the platform against the elements, I coated mine in truck bed liner.
In total, there are 5 3D printed parts:
- Motor mounting plate
- 3 Casters
- Main 324t drive gear and gear spacer
- Bubble level holder
- Adjustable homing sensor mount
I recommend printing with PETG filament, as it is less brittle than PLA. The .stl files for the parts can be downloaded from Thingiverse.
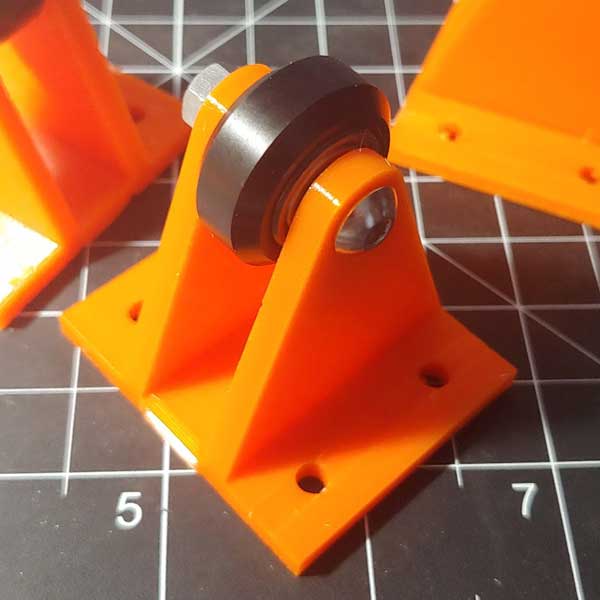
3D Printed Caster 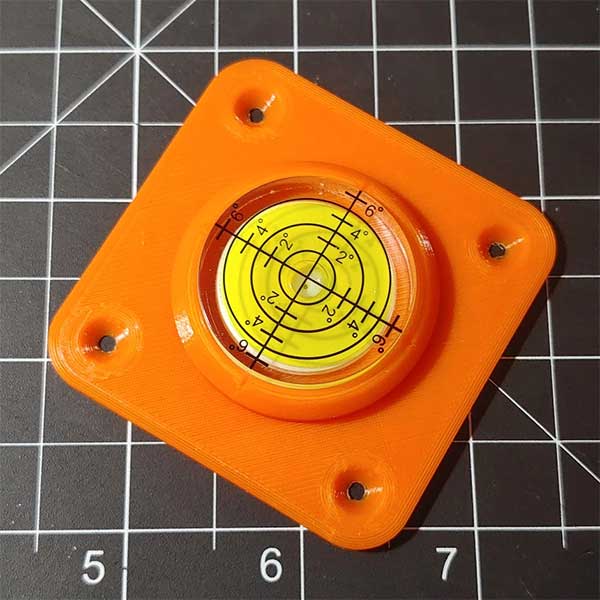
Bubble Level Holder
# Assembly Diagram
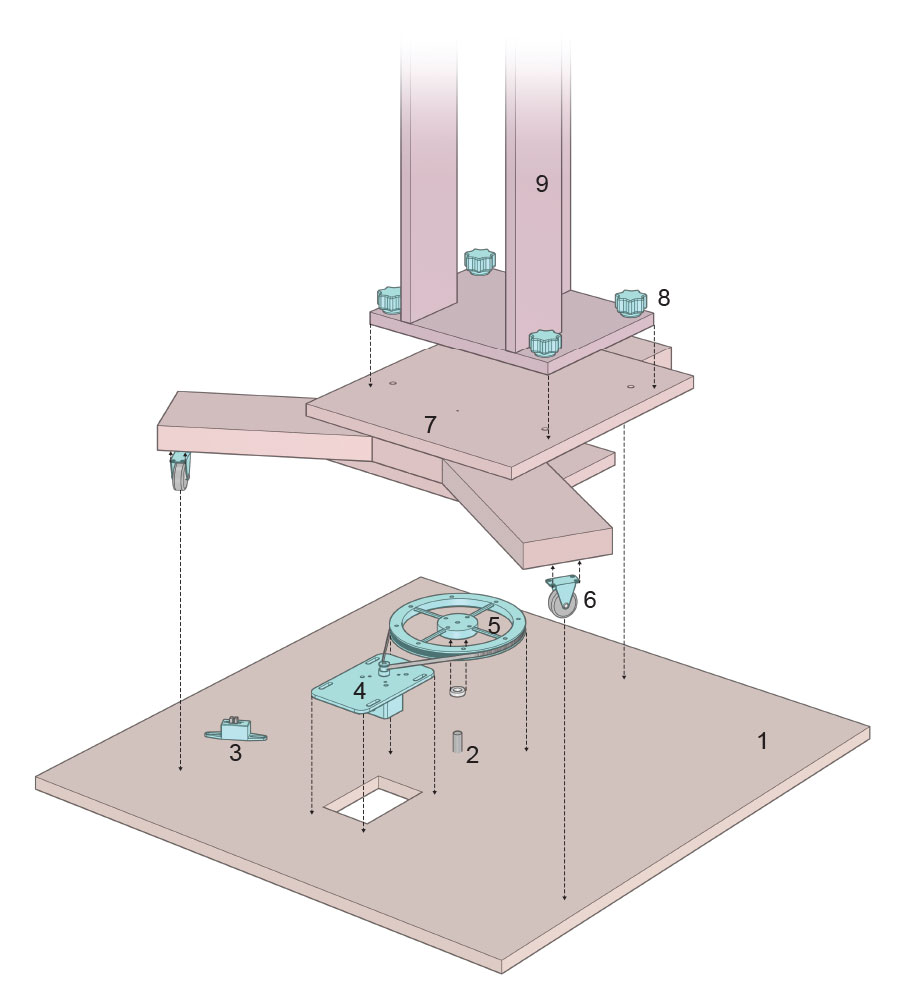
- Main plywood base – 36″ square (92cm)
- ½” bolt as the spindle about which the upper carriage rotates.
- 3D printed enclosure for an optical interrupt switch- I’m using one of these. This type of switch is commonly used in 3D printers.
- 3D printed mount for NEMA 23 motor. The mounting holes for this part are elongated to allow for belt tensioning.
- 3D printed GT2 profile gear, 324T. Combined with the 20T motor gear, the upper carriage will rotate exactly 1/9° per step, or exactly 1° per 9 steps. This also results in a torque increase from 1 lb/ft to 16 lb/ft.
- Custom 3D printed casters, using these pulley wheels commonly found in 3D printers. These wheels have ball bearings and a smooth, durable plastic bearing surface. Reducing drag is important for positional repeatability.
- Upper carriage constructed with 2×6 lumber and plywood. Four threaded inserts allow different test stands to be affixed.
- Wooden test stand. The height of this test stand should be as tall as possible for outdoor testing or a bit less than half the height of the room you are testing in if indoors. Be sure to mark the center of rotation on both the carriage and at the top of the test stand.
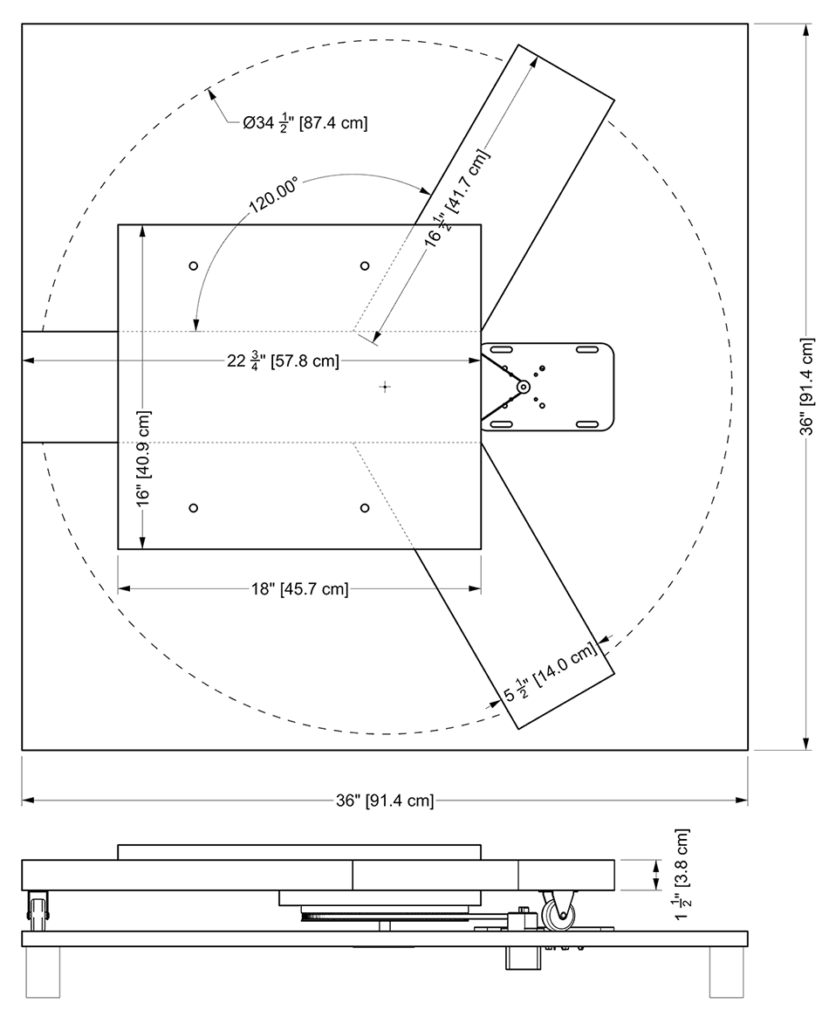
# Rough Dimensions
# About Quasi-Anechoic Measurements
Many people who are unfamiliar with DIY loudspeaker construction believe that an anechoic chamber is needed for acoustic measurements, since environmental noise and sound reflections will inevitably interfere with results. Fortunately, for us DIYers, this is not the case; in fact, arguably the best measurements available at present are made with the Klippel Near Field Scanner, which is a robotic measurement device which can be placed in an ordinary room.
The issue with environmental noise can be dealt with by averaging several measurements. In ARTA, always select two or more averages, as this allows it to cancel out any spurious noises.
The issue with room reflections requires a technique called gating.
# Gated Measurements
Here we have a frequency response measurement of a small monitor speaker. It was done in a room with a typical 8′ ceiling:
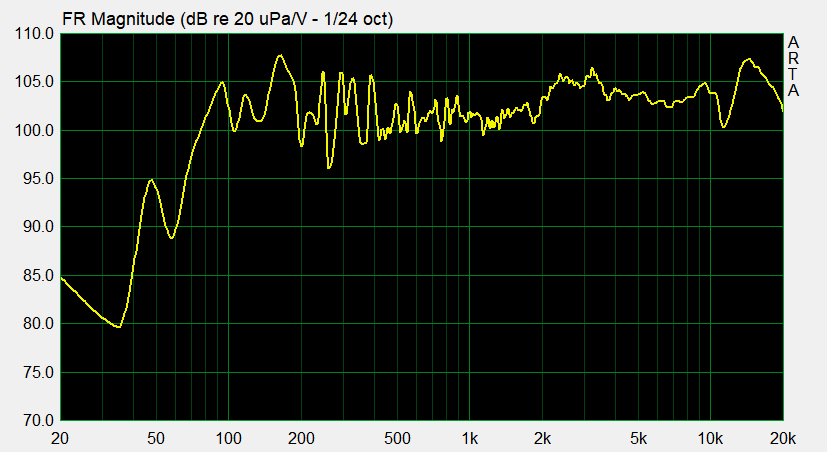
As you can see, there are clear irregularities in the measurement. In the bass region, there are huge variations caused by reflections from nearby surfaces. Fortunately, we can get rid of those.
This is the Impulse Response of the above measurement:
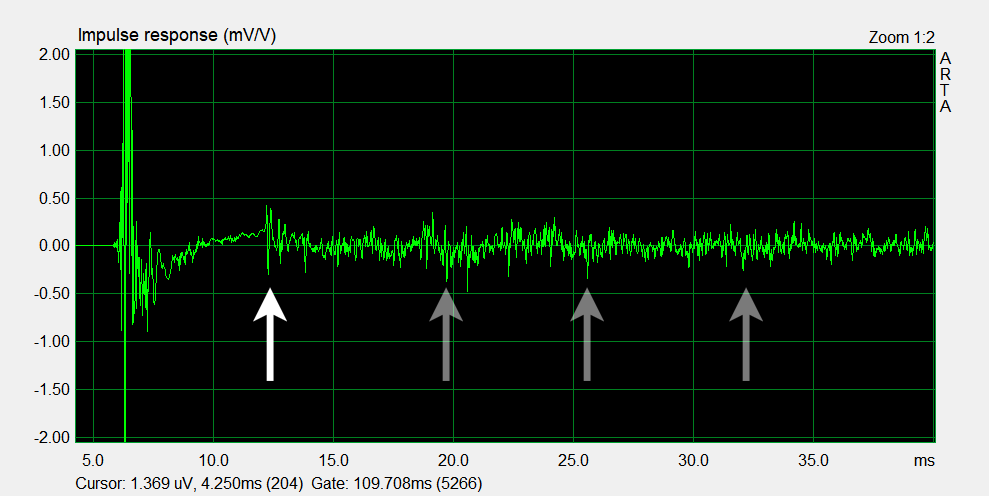
The Impulse Response of a measurement is a representation of how the loudspeaker would respond to an infinitely short, infinitely loud signal. Since we can’t generate such a signal, we use a frequency sweep for measurements, and then create the theoretical impulse response from that measurement. It is important to understand that the impulse response and the frequency response are the exact same data, viewed in two different ways. One shows time in the X axis, and one shows frequency in the X axis.
What does this do for us? Since the impulse response shows amplitude in the Y axis, and time on the X axis, it actually shows room reflections! Notice in the measurement above, there is a smooth area, going up to about 12ms, where there is a sudden jump in amplitude. This corresponds to the nearest reflective surface, probably the ceiling in this case. This is where gating comes into play:
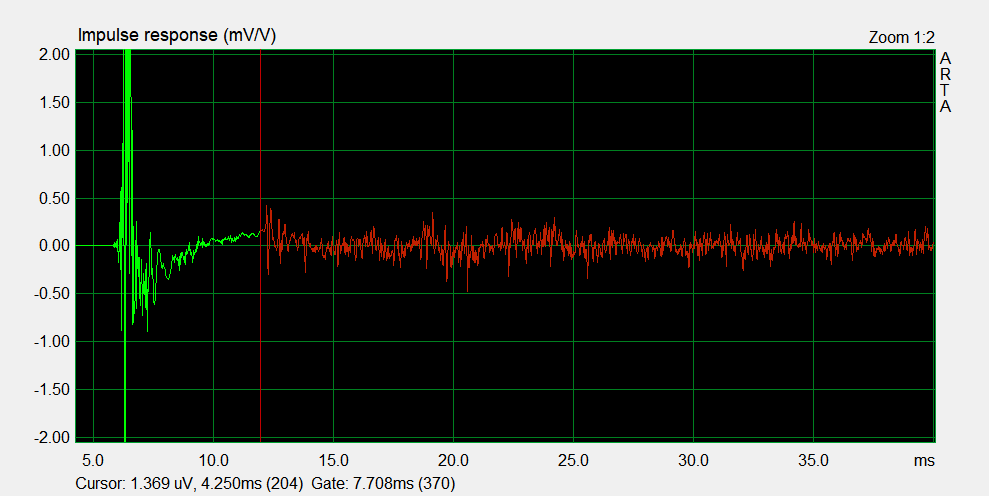
Gating is the process of selecting only part of the impulse response, in our case, the clean portion before about 12ms, and throwing away the rest of the data. By doing this we can generate a frequency response graph which is free from the effects of room reflections:
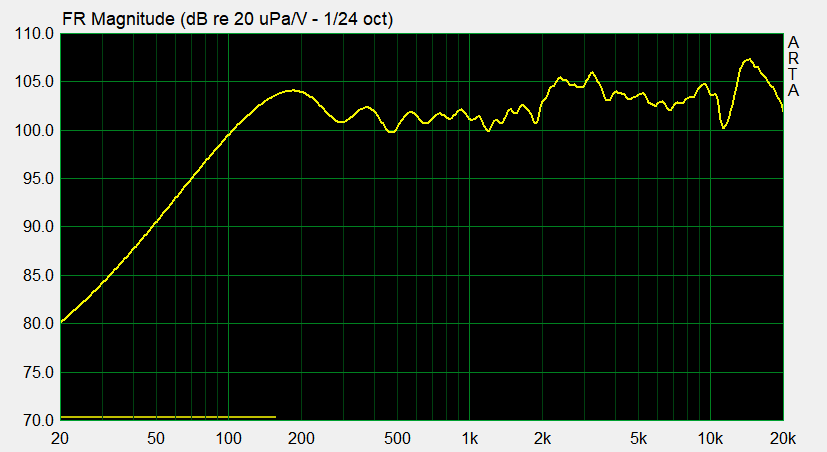
This chart now shows the true frequency response of the speaker without room reflections, with one caveat. If you look at the lower left of the chart, you will see a yellow line going from 20-180hz or so. This line shows the area of the chart that is not accurate. By gating, we are throwing away frequencies which take a long time to develop – low frequencies. As a result, if you measure in a small room, your gate will be short, and you will not capture low frequencies accurately.
There are two solutions to this problem. The first is to measure in a large space – I measure outdoors on a tall platform. This enables me to get measurements that are accurate down to under 100hz (good enough for most speaker design – speakers tend to radiate simply at low frequencies). The second solution is to take a secondary, near field measurement of the woofer, which can be adjusted and merged with the main measurement. Since the measurement is taken very close to the speaker, the reflections become relatively quiet compared to the very loud signal from the woofer.
You can see an overview of how to do this a paper by Jeff Bagby. This is the same technique used by Stereophile magazine.
# Frequently asked questions
What sort of microphone do I need?
Any ordinary measurement microphone will work. I recommend a Dayton EMM-6. These come with a calibration file you can load into ARTA. It is important not to buy a USB microphone. The microphone must be a passive type with an XLR connector. The USB interface in USB microphones introduces delays which makes accurate relative phase measurement impossible with ARTA. Be sure to read the ARTA documentation section on ‘dual channel measurement’.
USB mics are fine for measuring room responses, but for capturing the relative time of flight between different transducers, dual channel measurement is a must.
Does this platform work with REW or other software?
REW does not work with Arta_Tic, but you can control the platform from your computer pretty easily. Ticcmd, the windows command line application for controlling Tics, can be controlled with a series of shortcut files, or with the Tic interface software. If there is significant interest, extending Arta_Tic to REW would be possible, but that is up to the makers of REW.
What measurement settings should I use?
This depends on context, but I find these settings work well for me:
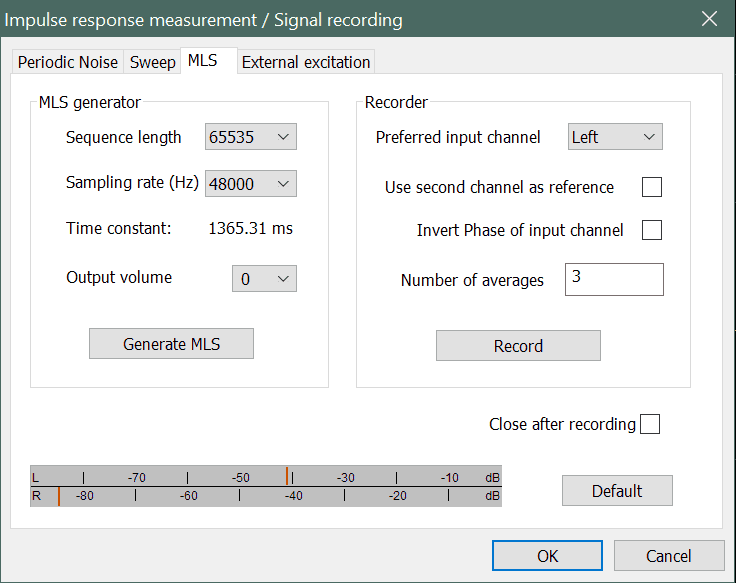
The measurement signal takes about 6 seconds total, with 3 averages to reduce noise.
How long does it take to measure a speaker?
With the settings above, the measurement signal is 6 seconds. If you add a 2 second travel time for the platform, each individual measurement is 8 seconds.
To calculate the total measurement time, you need to know a few things. One, the angular resolution you want to use. 15° is pretty standard, but for speakers with complex high frequency radiation, 10° or less may be desirable. If a speaker is symmetrical, you don’t need to measure the full 360° in that axis. For example, if you are measuring a normal speaker where the drivers are all centered on the front baffle, you don’t need to measure the left and right sides, as they will be identical.
You also need to know how many drivers you intend to measure. If you’re measuring a completed design, this isn’t a factor. However, for a 2 way speaker, you will be measuring 2 drivers, for a 3 way, 3 drivers and so on.
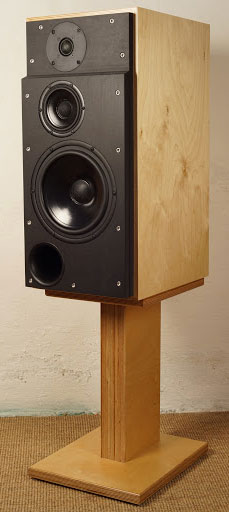
So, let’s take an as an example this fairly complex 3W Classic design by Troels Gravesen, having 3 drivers, two off-center.
Horizontal Axis
Tweeter is non-symmetrical, so 360°/15° = 24 measurements.
Midrange is non-symmetrical (24)
Woofer is symmetrical (12)
Vertical Axis:
All drivers are non-symmetrical about this axis, so each requires 24 measurements, *3 drivers = 72 measurements.
Total = 132 Measurements
Assuming 1 minute between each measurement type, and 3 minutes to switch the speaker from vertical to horizontal, you can measure a complex speaker like this in around 26 minutes. For a symmetrical two-way speaker, measurements will take around 15 minutes.